Last week, two Grant Witness charts made appearances in a hearing of the House Science, Space, and Technology Committee. Rep. Whitesides (D-CA) showed our recent plot of National Science Foundation award-making, showing that NSF has made 60-70% fewer awards by at point in the fiscal year than in previous years.
In response, Rep. Rich McCormick (R-GA), pulled up our plot of NSF’s cumulative obligations, which he described as “It’s a little bit less but it’s very much more on par as far as the spend versus the number of awards.”
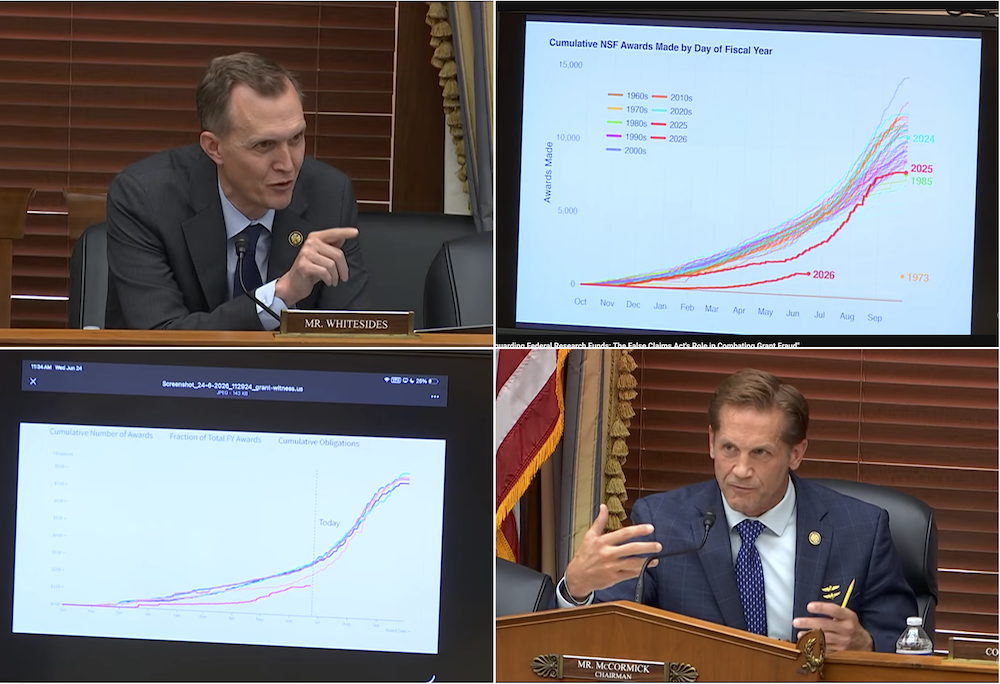
This is a stretch — funding so far this year is 30-40% lower than the same date in previous years. Nonetheless, how has NSF managed to spend at nearly double the pace at which it is making new awards?
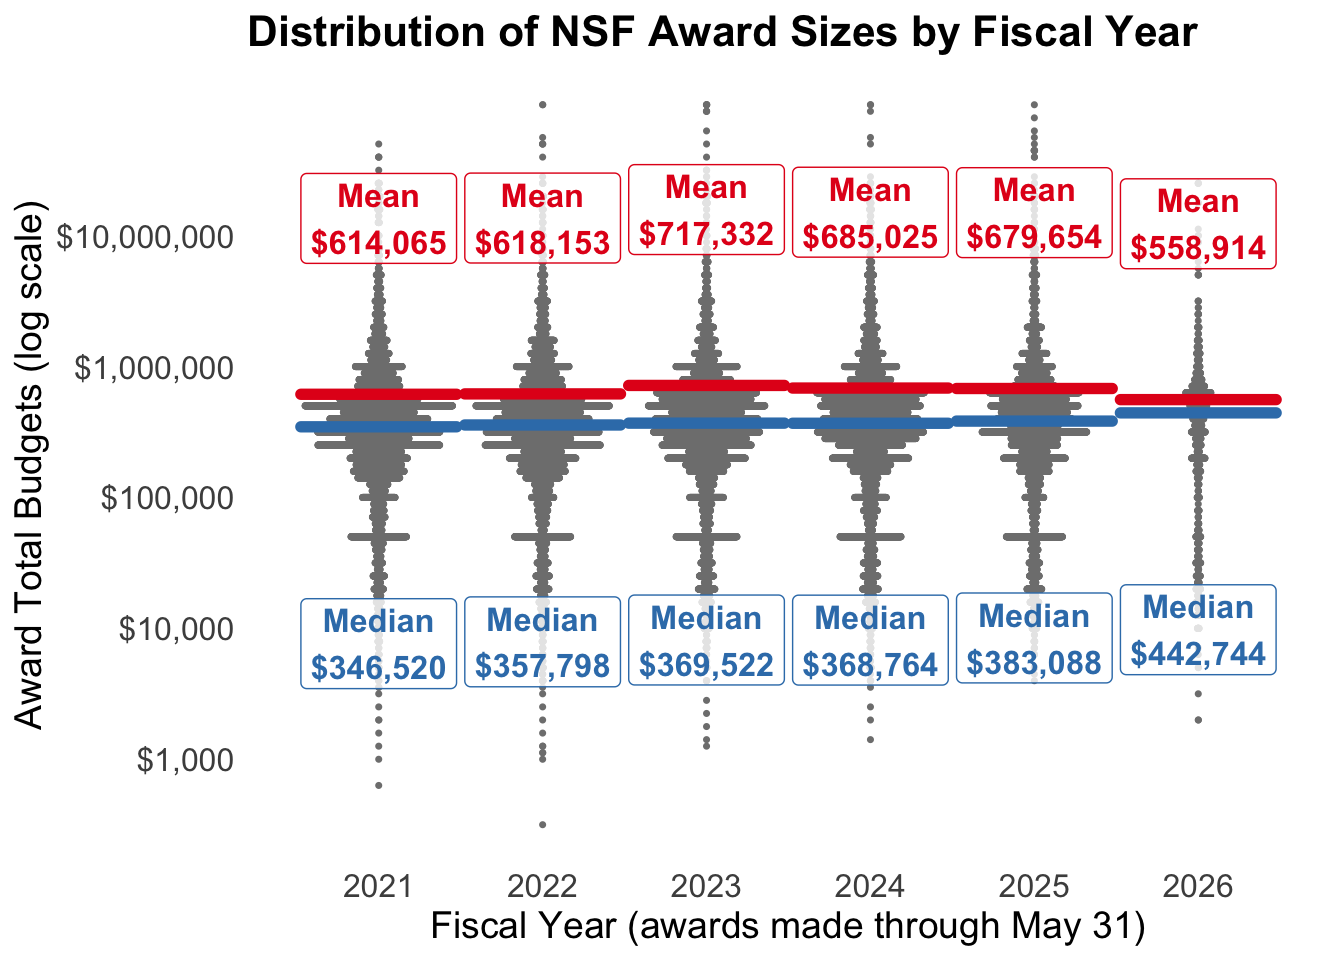
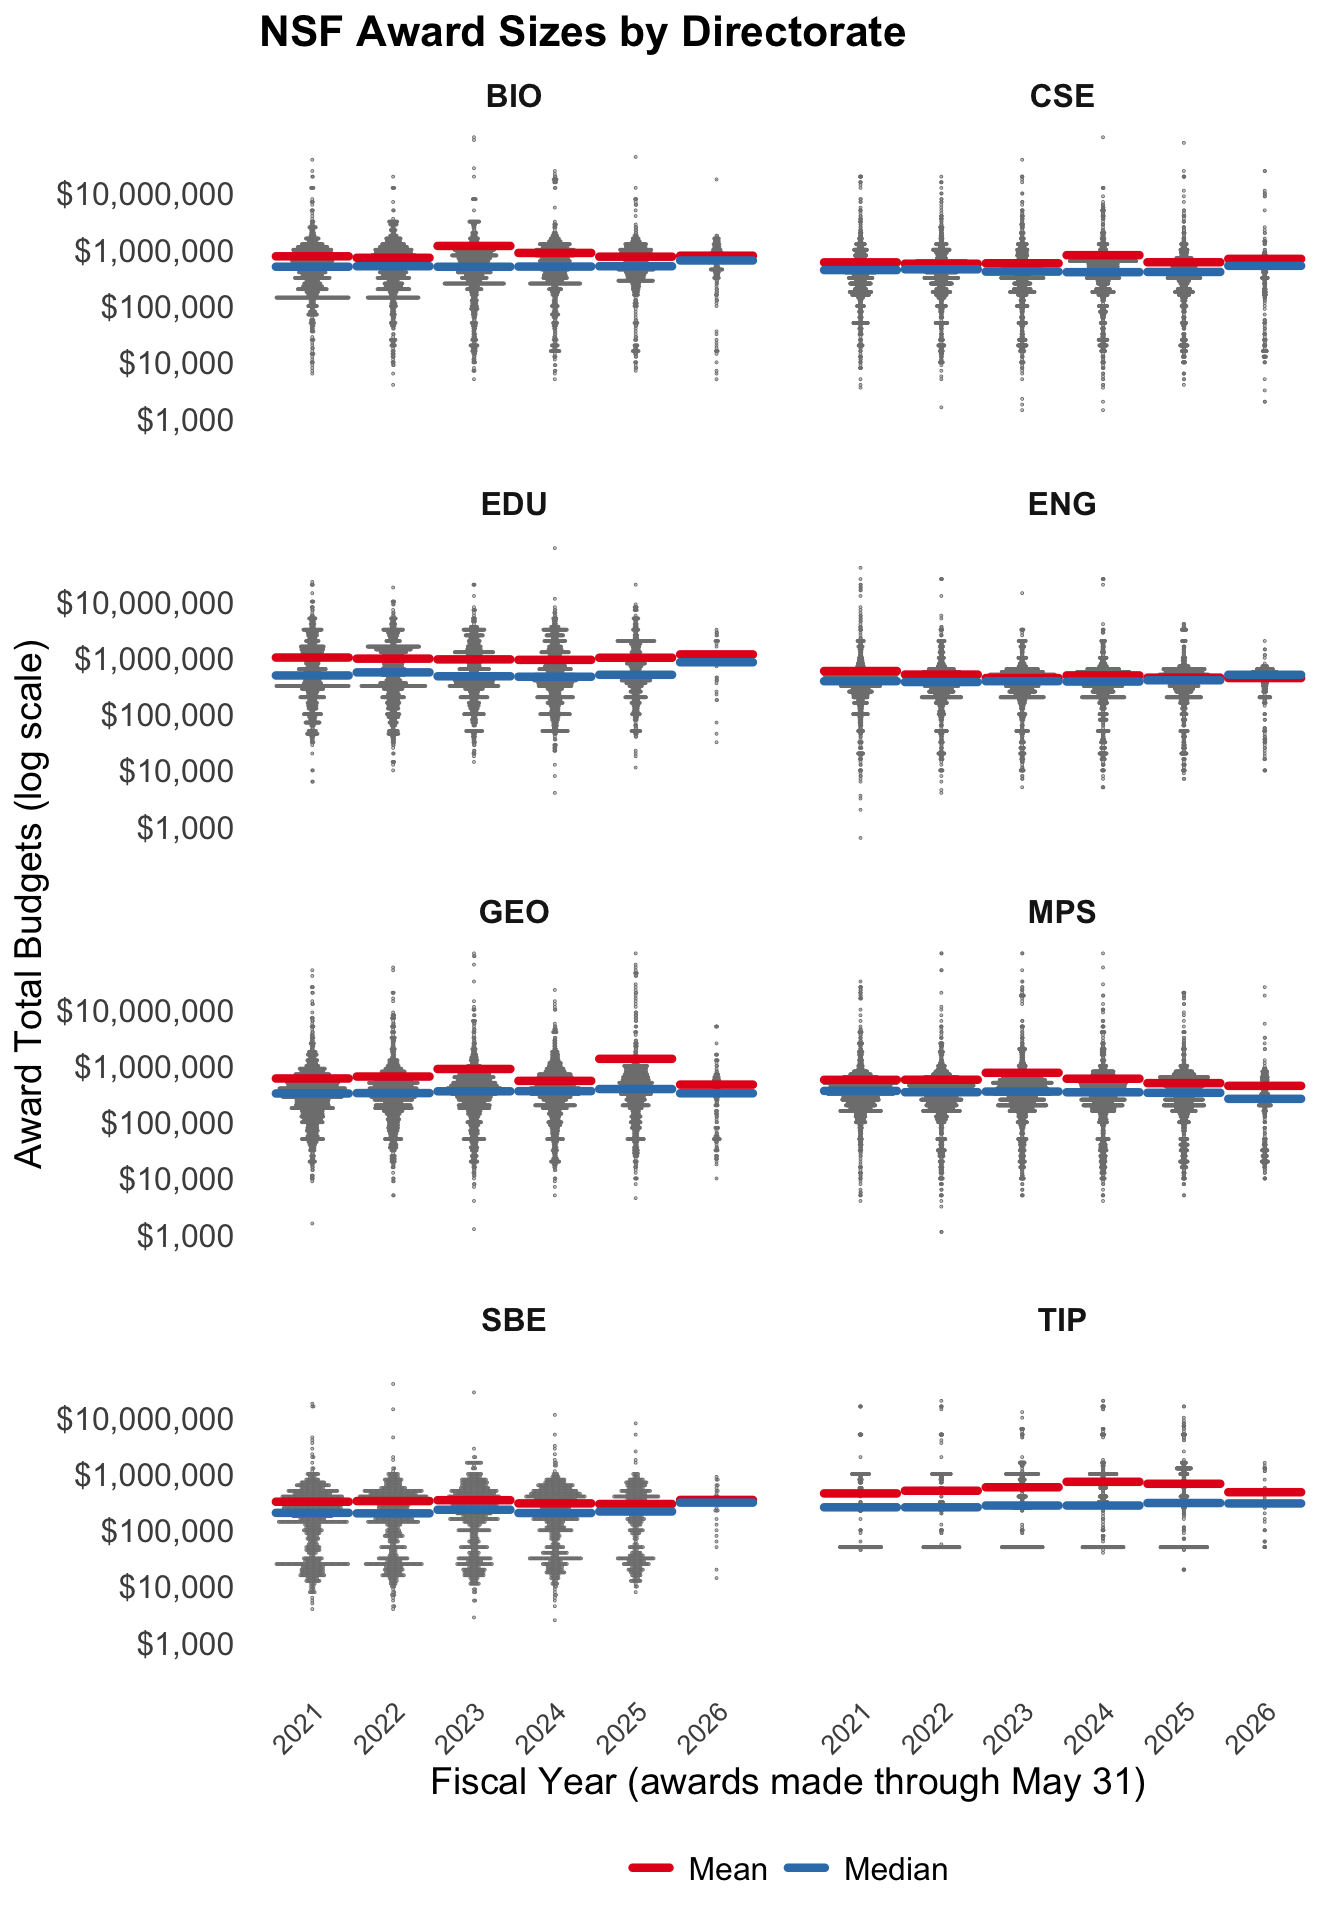
NSF awards are not getting any larger
The average NSF award size is about $100,000 smaller in 2026 than in the past five years. This smaller mean size is largely because of fewer very large awards – NSF has not initiated any projects with budgets of $30 million in 2026. The median award size is larger. This is mostly because NSF has awarded very few small awards and fellowships, in particular I-Corps awards.
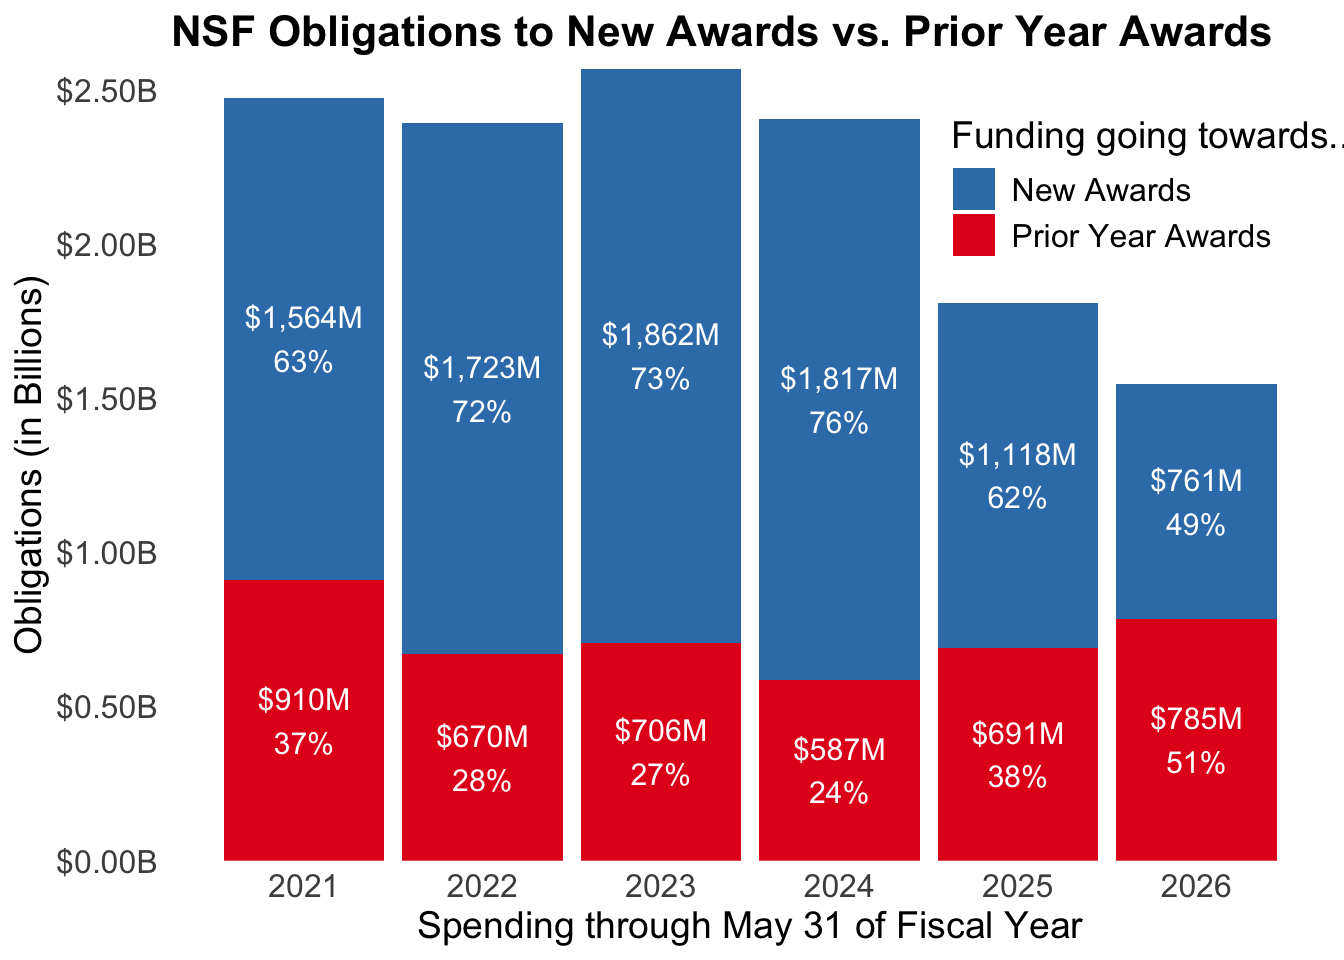
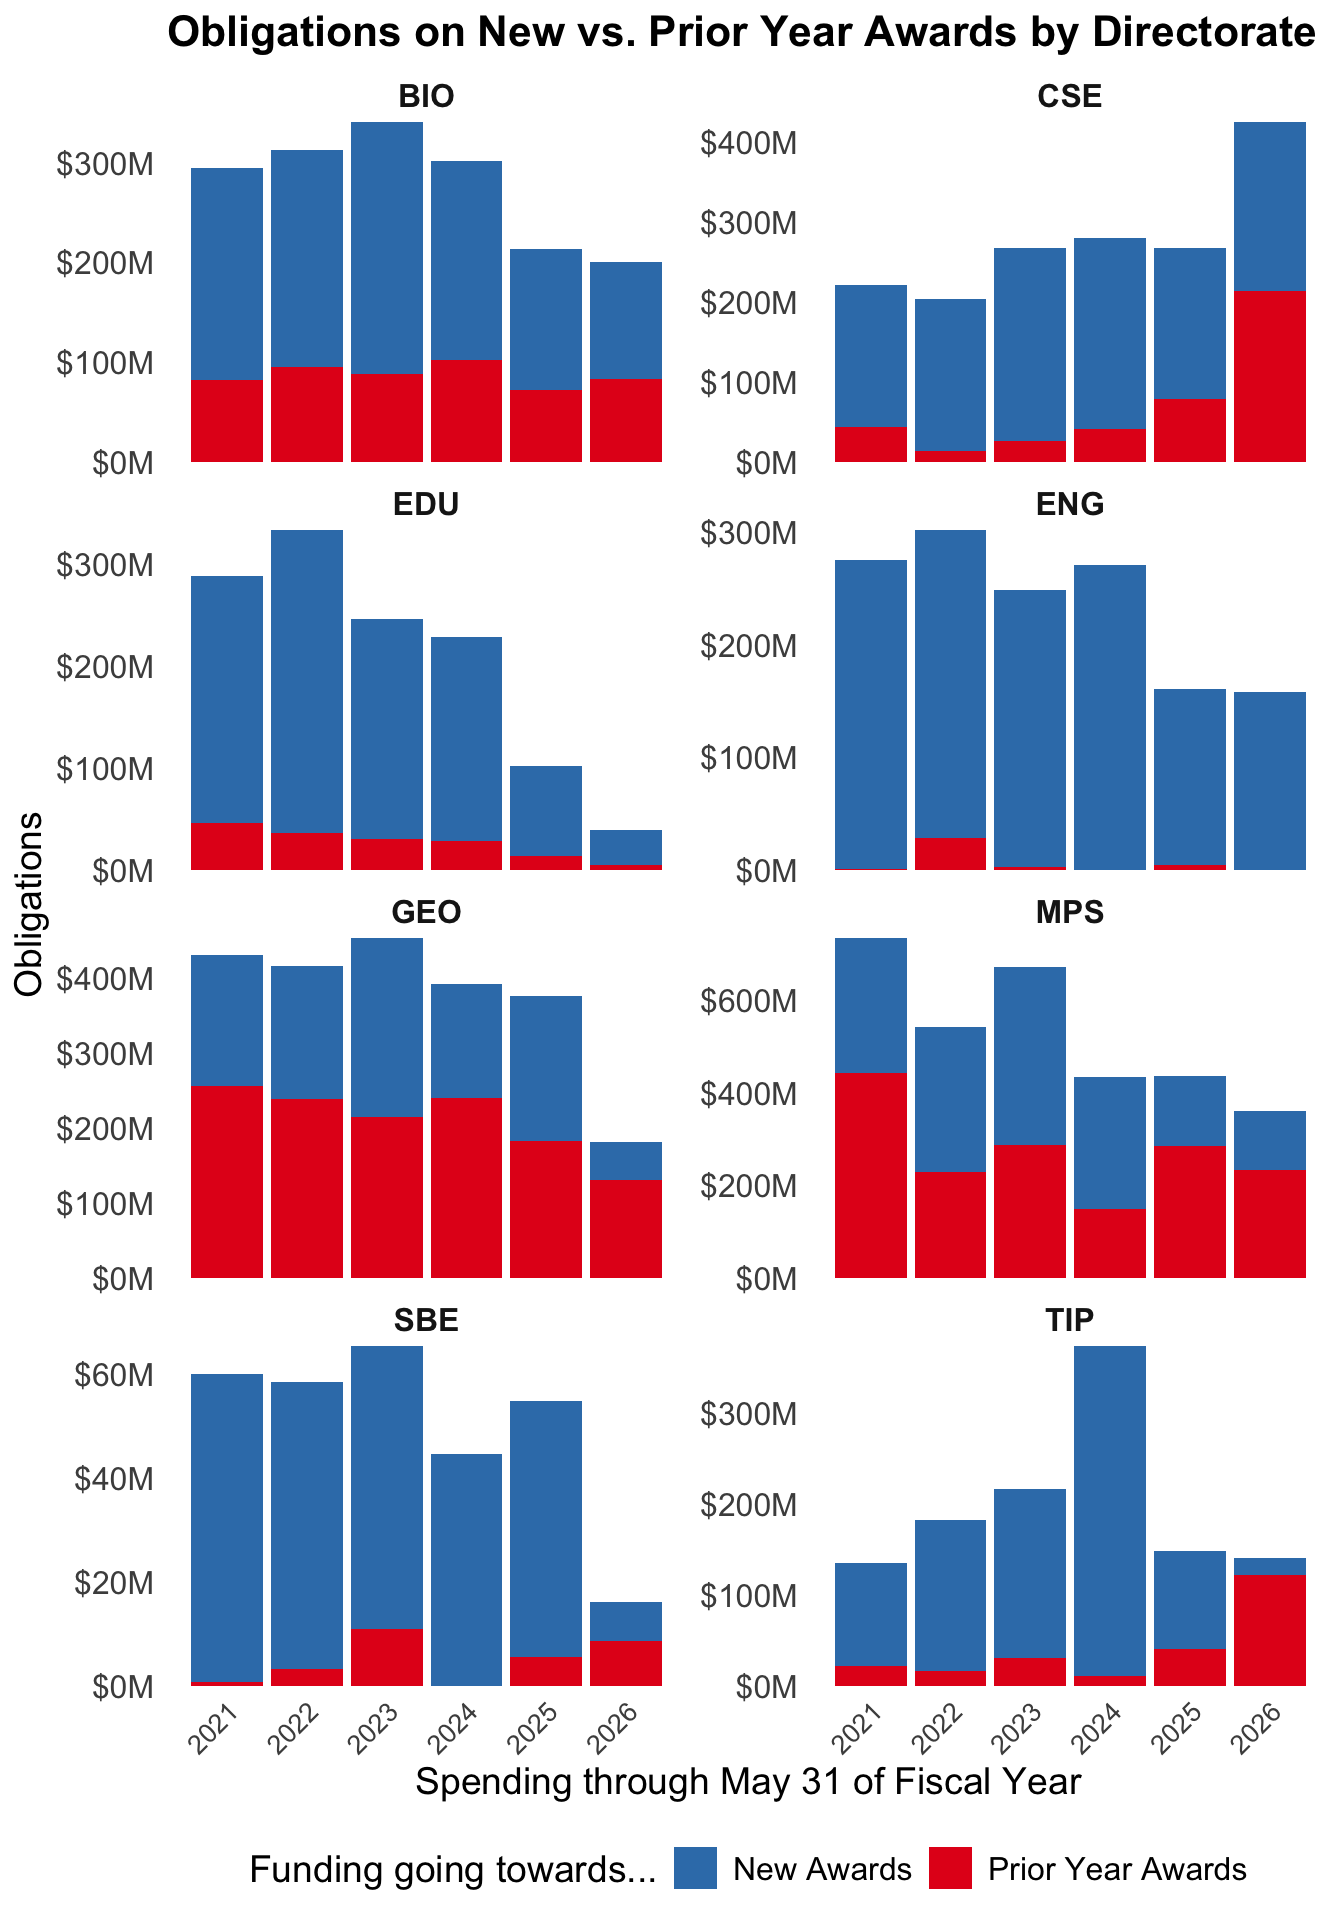
More money is servicing prior year awards
From the start of the fiscal year through May 311, NSF obligated more of its annual budget to servicing prior year awards than to new awards. This is primarily due to the slow pace of new awards in 2026.
While the servicing of prior awards is high, more than $200 million of that went to a single project, the construction of Leadership-Class Computing Facility (LCCF) at the University of Texas at Austin. This is the most ever obligated to a single project in one year of NSF history. But it is a long-planned project, started in 2024, with this year’s spending approved by Congress in its 2026 budget committee report. Aside from the LCCF, NSF is spending less on prior year awards than most prior years, too, but those prior year awards provide a floor for NSF spending, at least for awards they have not terminated.
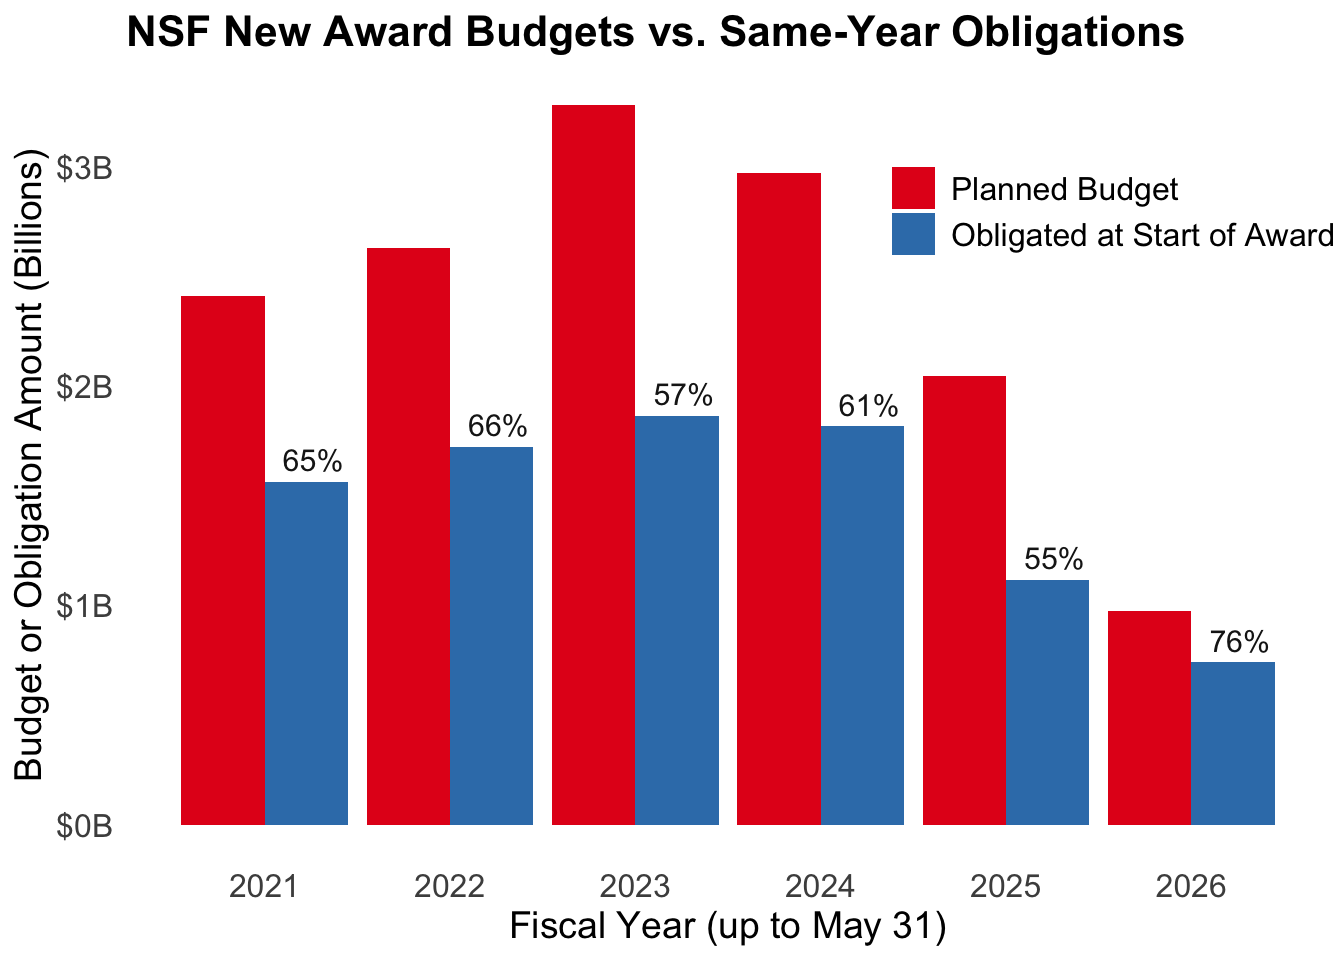
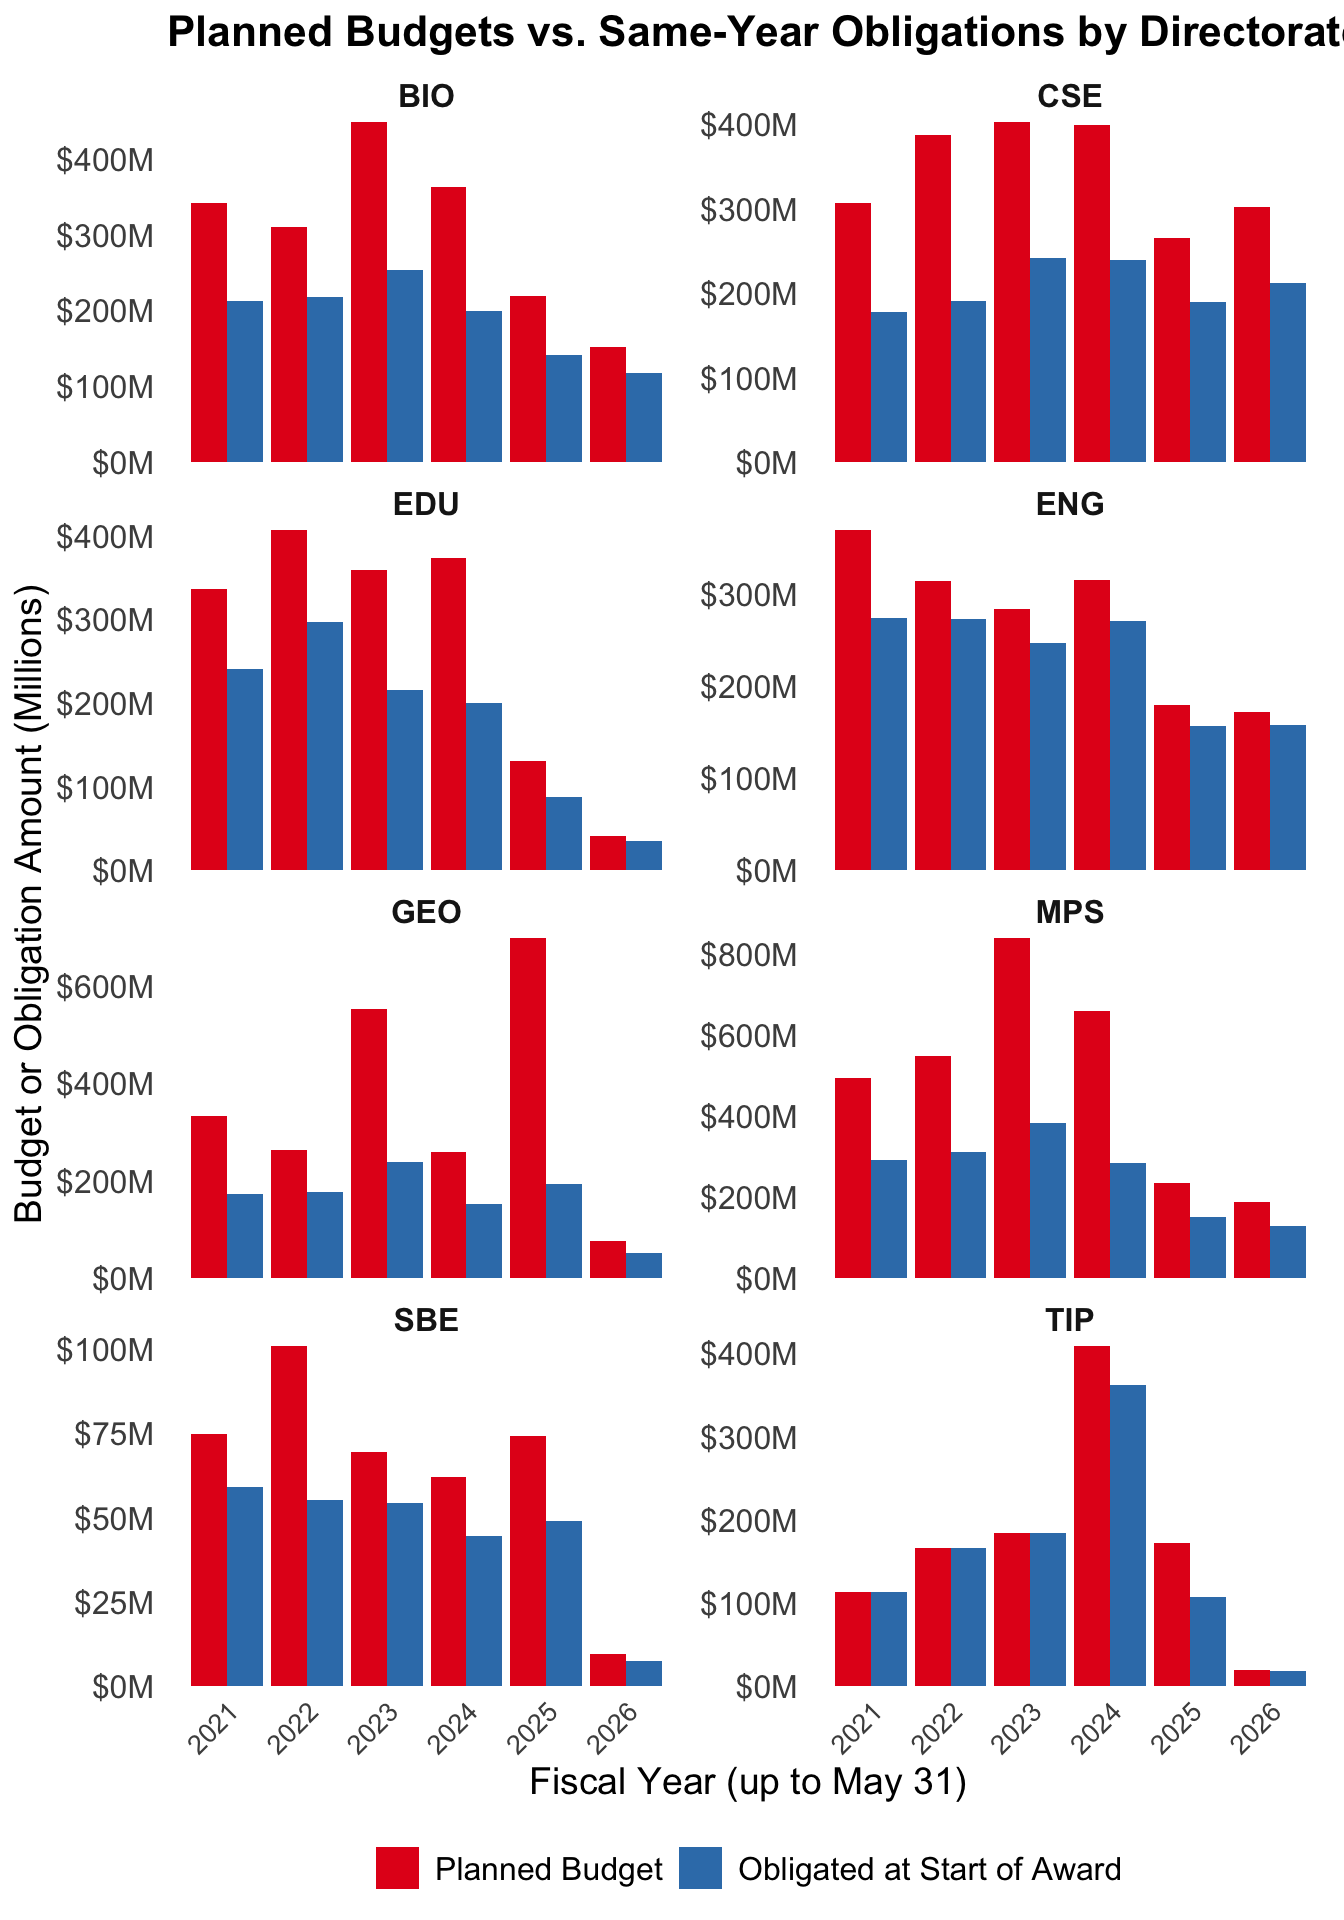
NSF is forward-funding new awards to spend more money on less science
Despite not making new awards any larger, NSF is obligating more funds per award than prior years. It is doing so by obligating a larger fraction of total award budgets up front, rather than making smaller obligations over the course of the award. Much as NIH has heavily increased its “multiyear funding” mechanism, NSF is drastically reducing “Continuing Grants,” in which funding is doled out slowly over time. This does not provide any more funding for researchers, who must still spend the same amount of money over the same time. Yet it reduces the number of new awards in the year, shrinking the number of projects, lines of research, and ultimately labs and scientific capacity of the U.S..
Overall, this spending pattern reveals an agency not investing in the future. Rather, it appears that NSF is spending to meet its legal obligations while actually clearing the decks with a plan to be a much smaller, different agency. That may be an NSF less than half the size, as the President’s 2027 Budget proposes, or an NSF diverting its funds to the President’s own priorities. Neither of these have the support of Congress or the American public.
Appendix: Breaking it Down by Directorate
These patterns are broadly consistent across NSF’s directorates, though the magnitude differs and certain directorates are heavy drivers of the “spend less, do even less” strategy.
The STEM Education (EDU) and Social, Behavioral, and Economics (SBE) directorates have seen their average award size increase, despite extremely low numbers and spending on awards. Nearly all their 2026 awards are forward-funded, clearing the decks of any future commitments. This pattern is most extreme for the Technology, Innovation, and Partnerships (TIP) directorate (though its news awards have picked up in the last few weeks).
Geology (GEO) has the most of its budget going to prior-year awards, as large-scale infrastructure projects continue to be funded even as new awards have cratered, with a similar but more modest pattern in Mathematics and Physical Sciences (MPS).
Engineering (ENG) is an outlier as it has little history of making long-term awards, so has few prior-year commitments or new ones on the horizon, and continues to make awards at a similar pace as prior years. Computer and Information Sciences and Engineering (CSE) is the only directorate where the funding pattern reflects a continued investment in the future, with both more overall funds spent and more future commitments than in the past.
Footnotes
All data in this post compares the same period of the fiscal year, through May 31, for each year. This is the most recent date for which we have complete obligations data from USAspending.gov.↩︎