The National Science Foundation is on track for its worst year in over half a century. NSF grant records go back to 1960, giving us a long baseline to judge the scale of the current slowdown. What that history reveals is not just a departure from recent norms or a pre-COVID baseline, but a reversal of over five decades of growth in American science investment.
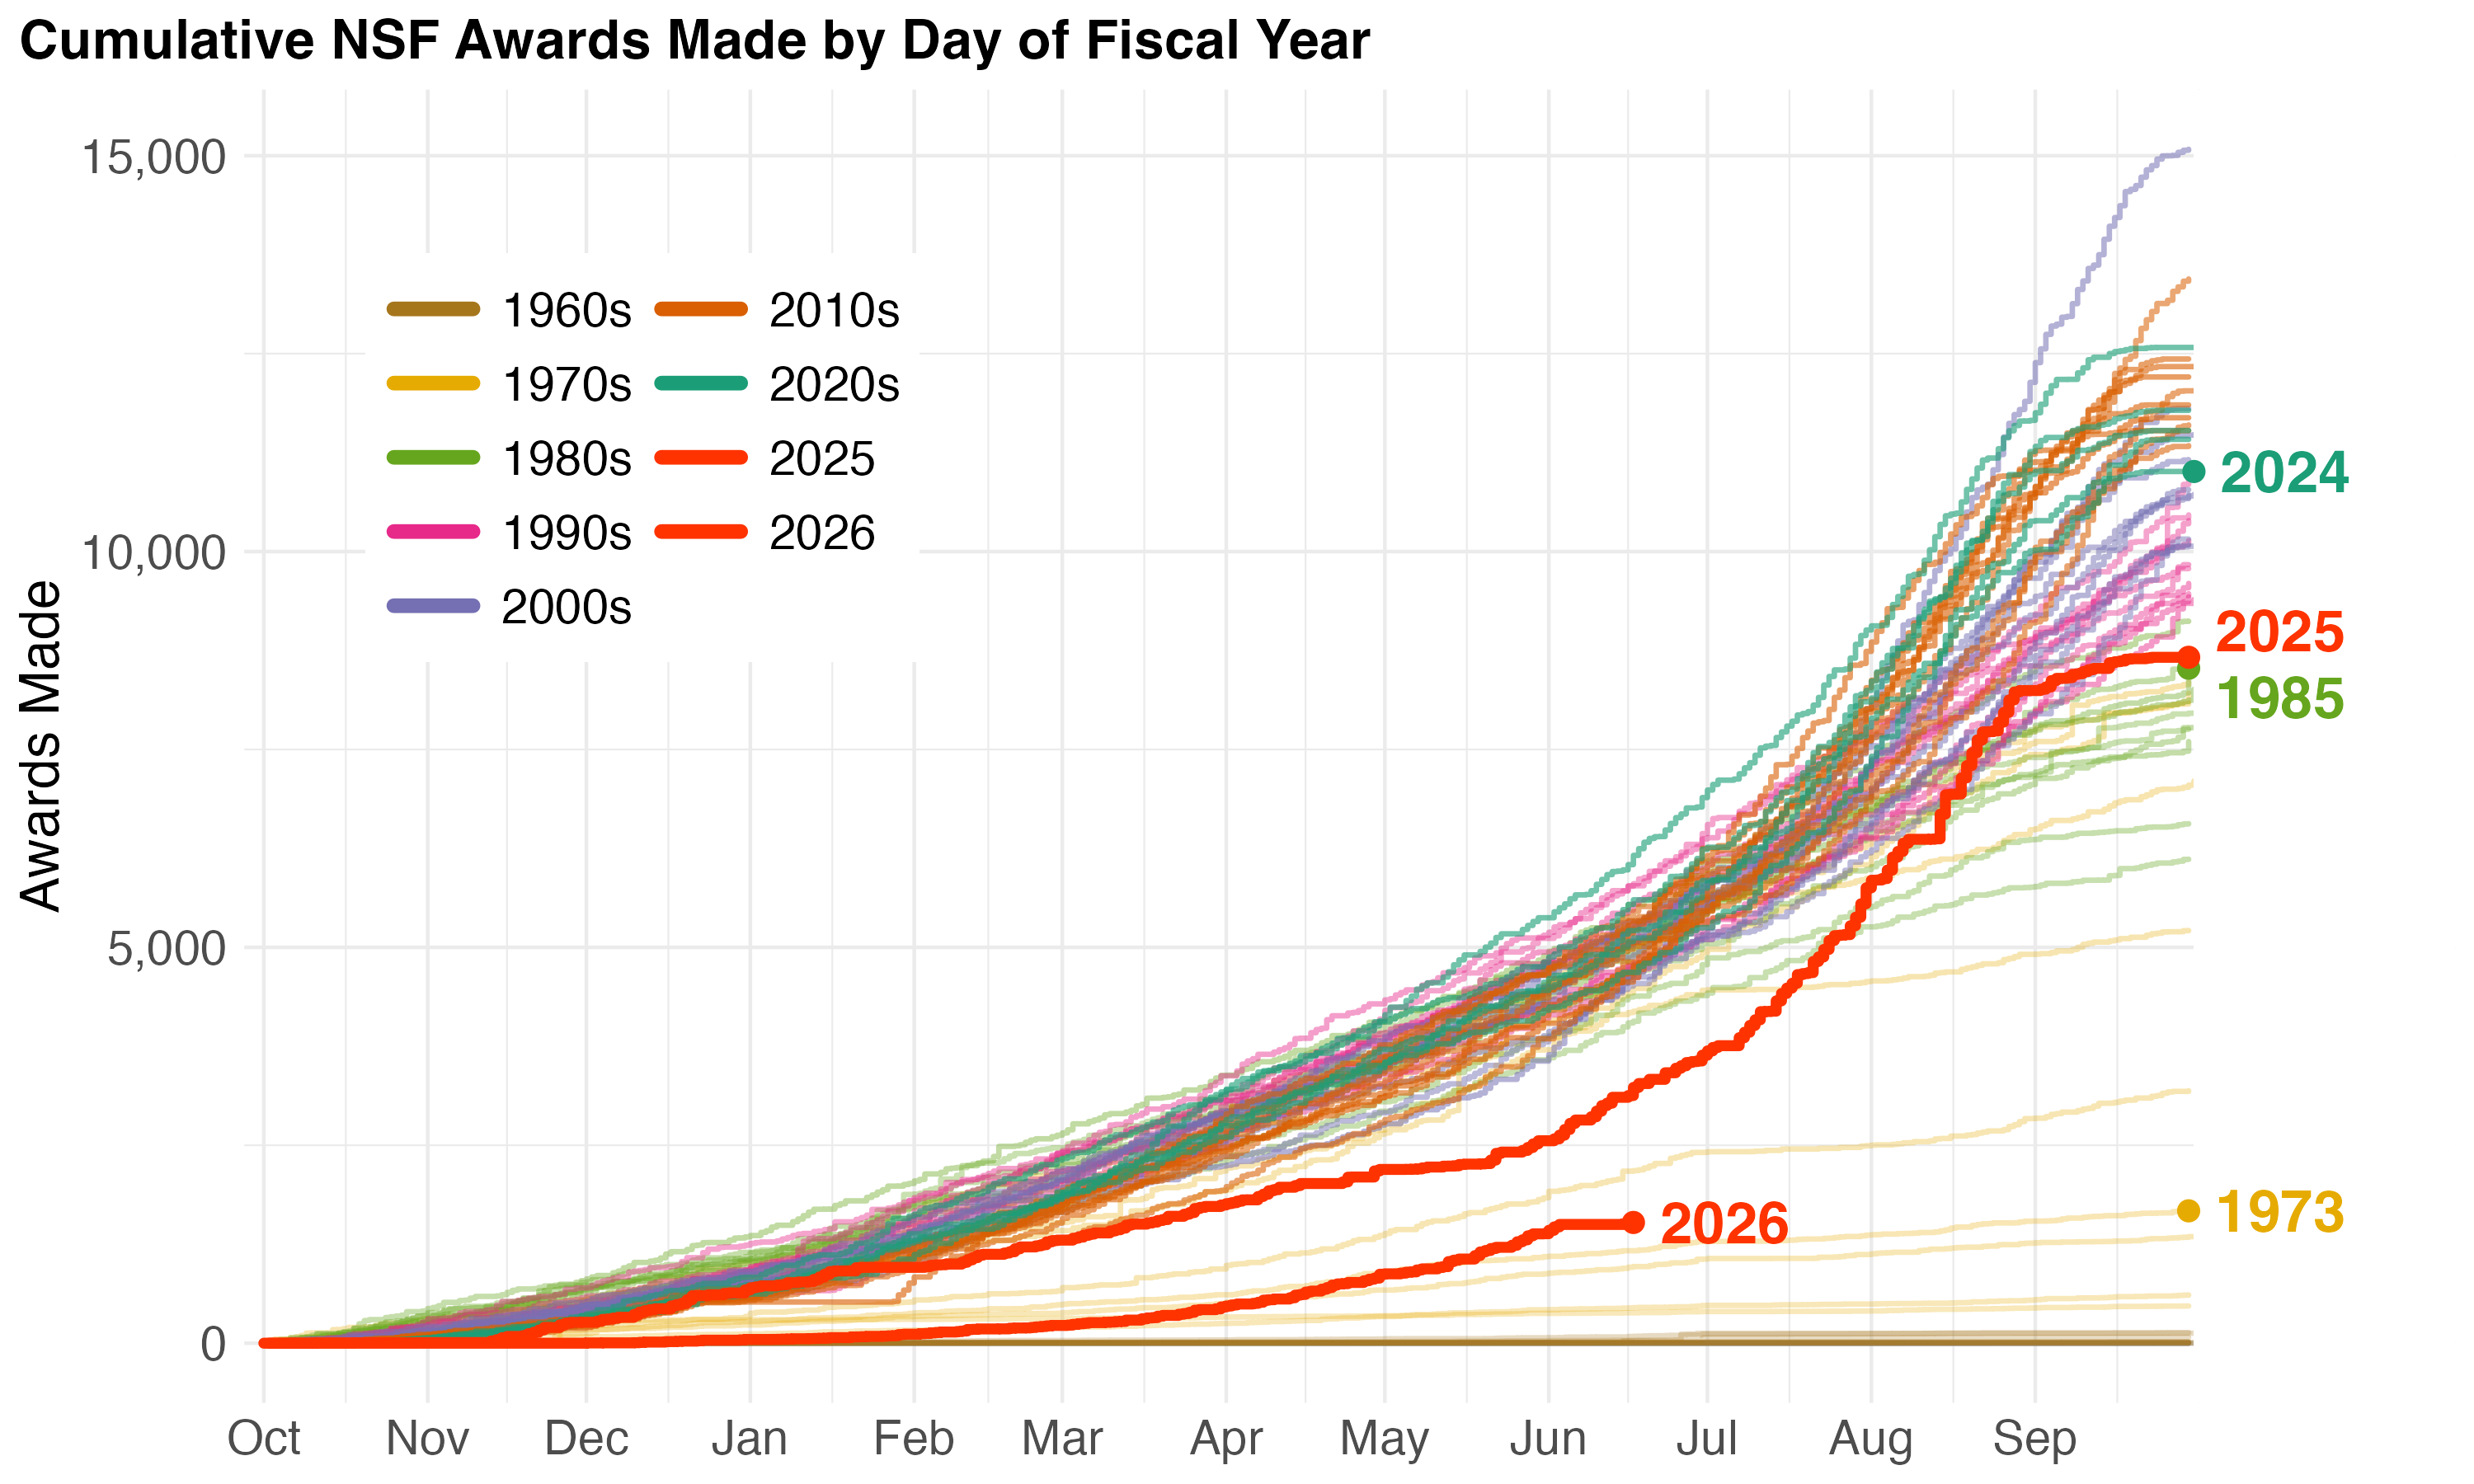
In 2025, the NSF made about 8,650 awards.1 The last time it made so few awards was in 1985. This year’s trajectory is far worse. It looks most similar to 1973, when the NSF made only about 1,700 awards in total. While it is possible that the NSF could accelerate its award pace in the final months of the year, the current trajectory is so far below all other years that it would require an unprecedented surge in awards to pull us back up to anywhere near recent levels, especially given the interruptions like the recent pause.
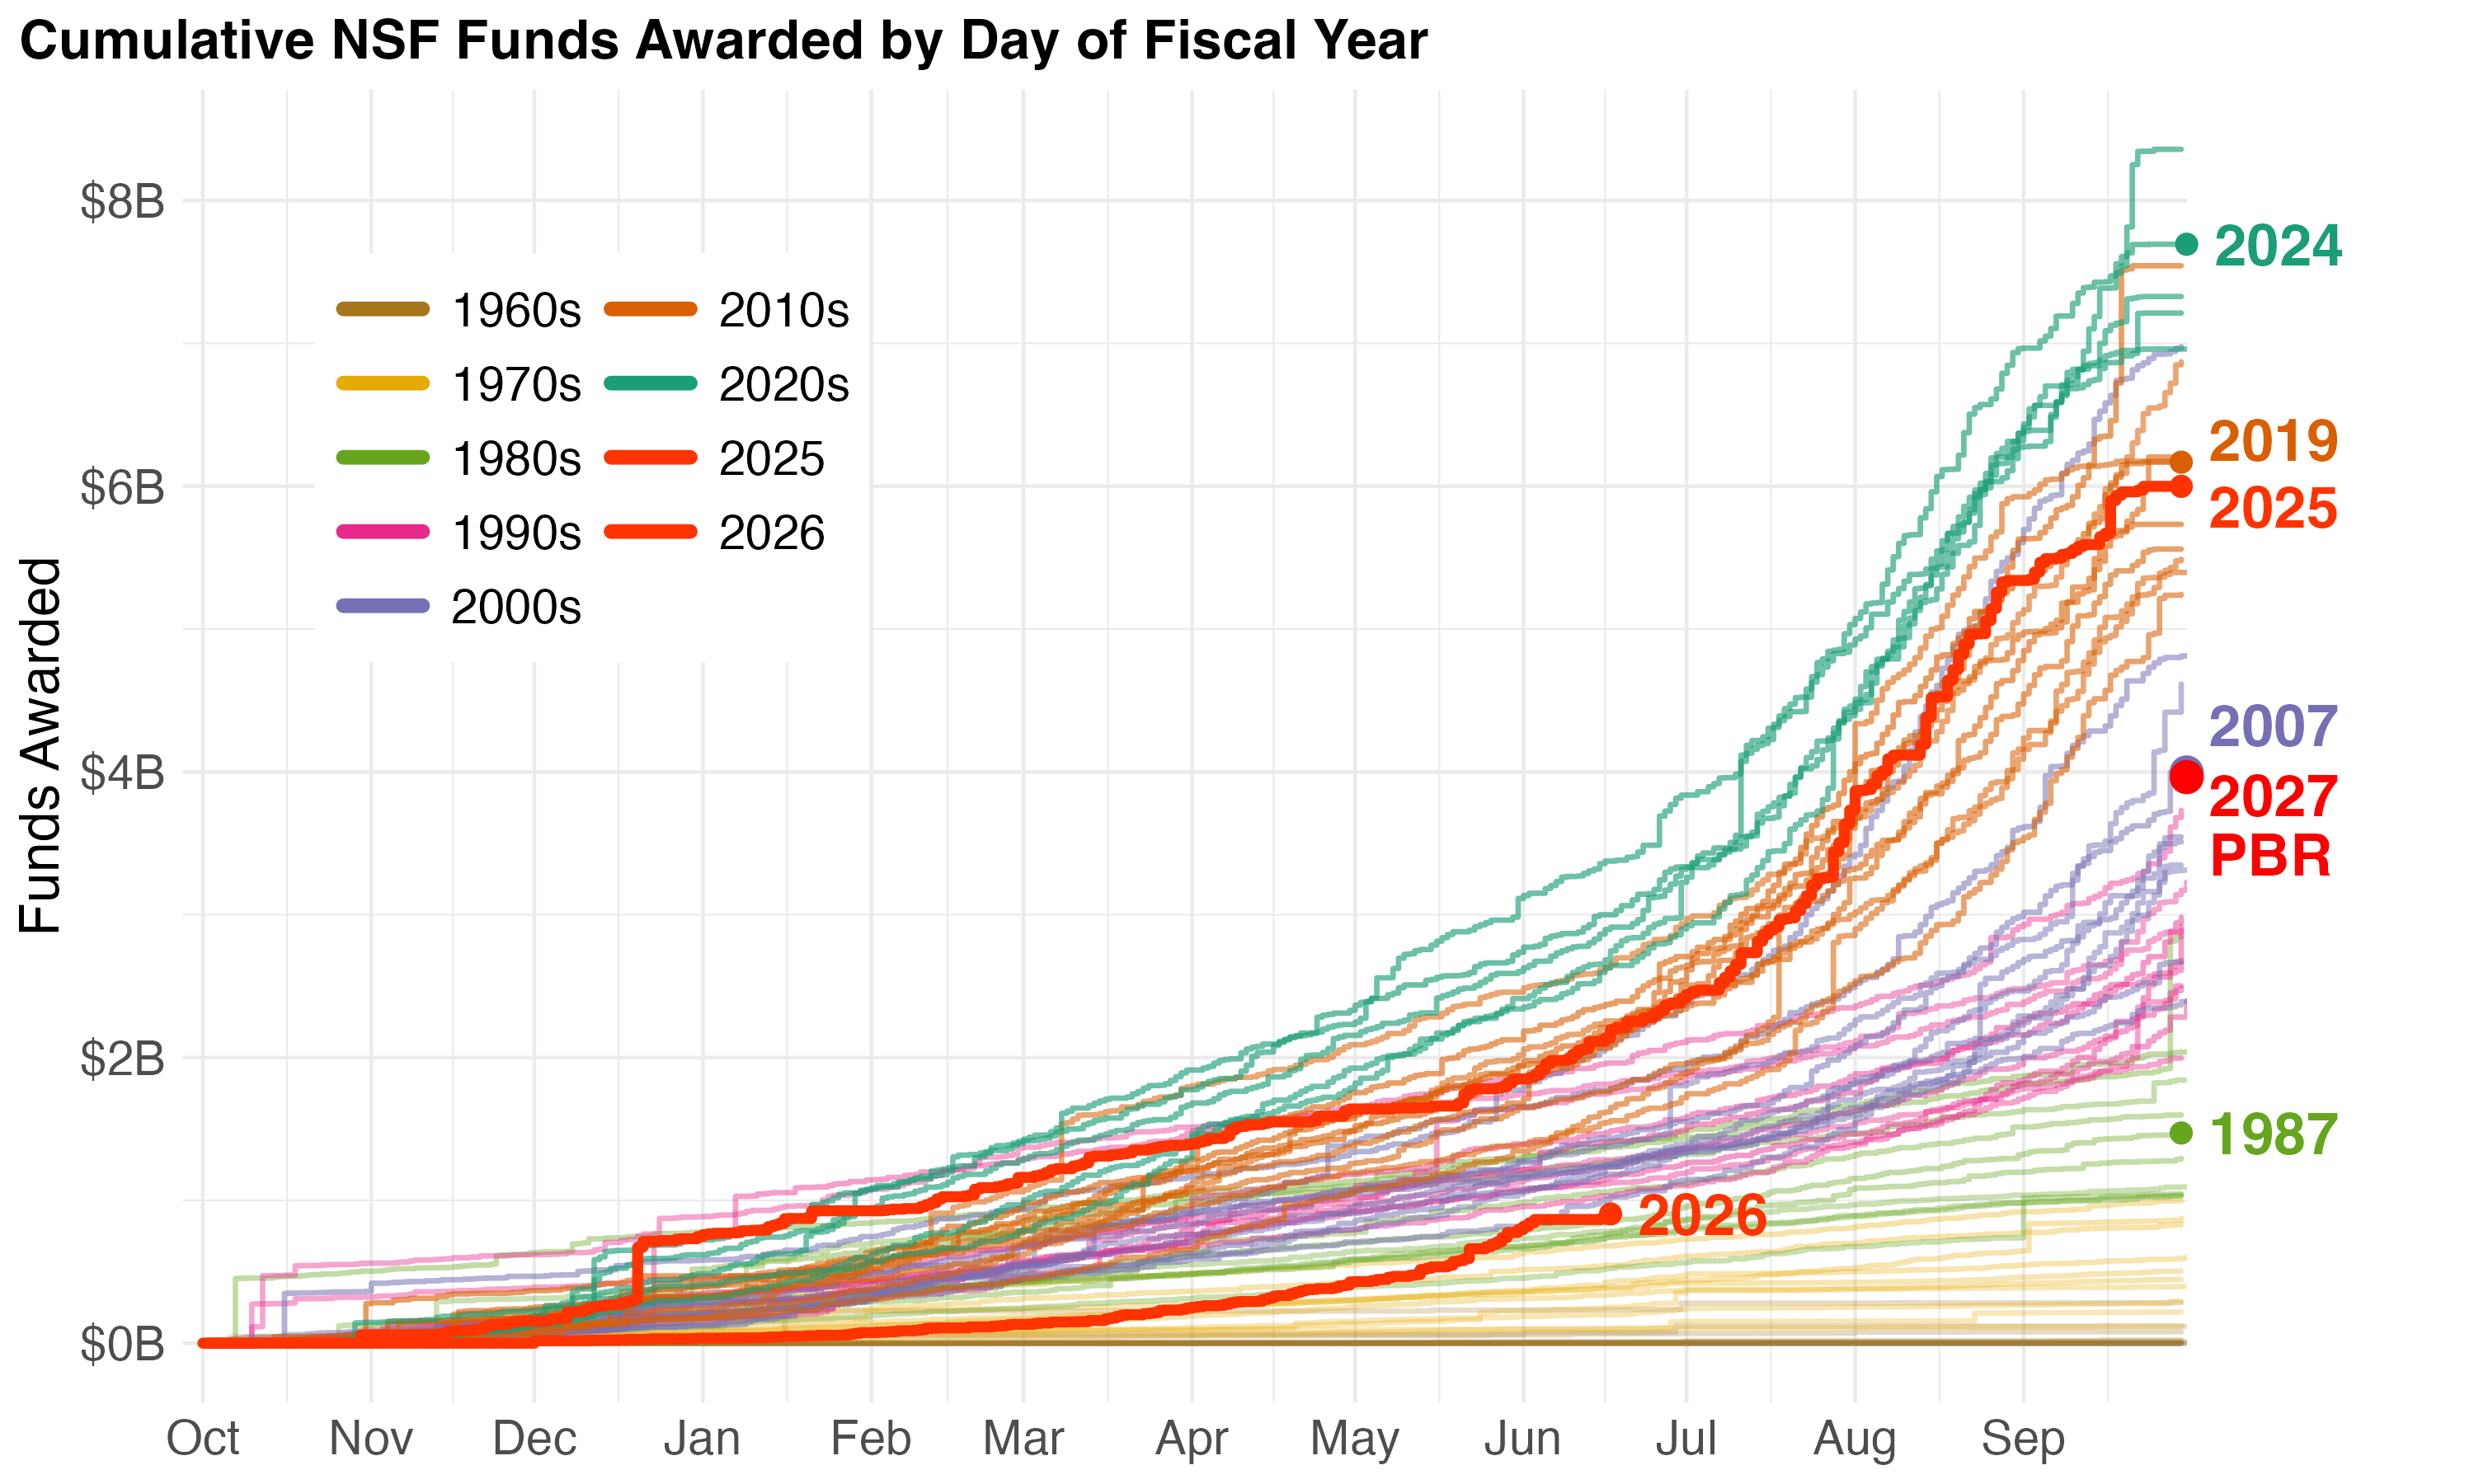
If we look at dollars rather than awards, the picture is scarcely better. Last year, despite ostensibly spending its full congressional appropriation of $8.2 billion, newly awarded project budgets only amounted to about $6 billion, more than a 25% drop from the previous year and a number last seen in 2019.2 This year so far, new awards’ budgets amount to less than $1 billion - 12% of the overall budget and a number last seen in 1987. For 2027, the president’s budget request is $3.96 billion, a twenty-year setback even if they spend it all on new awards.
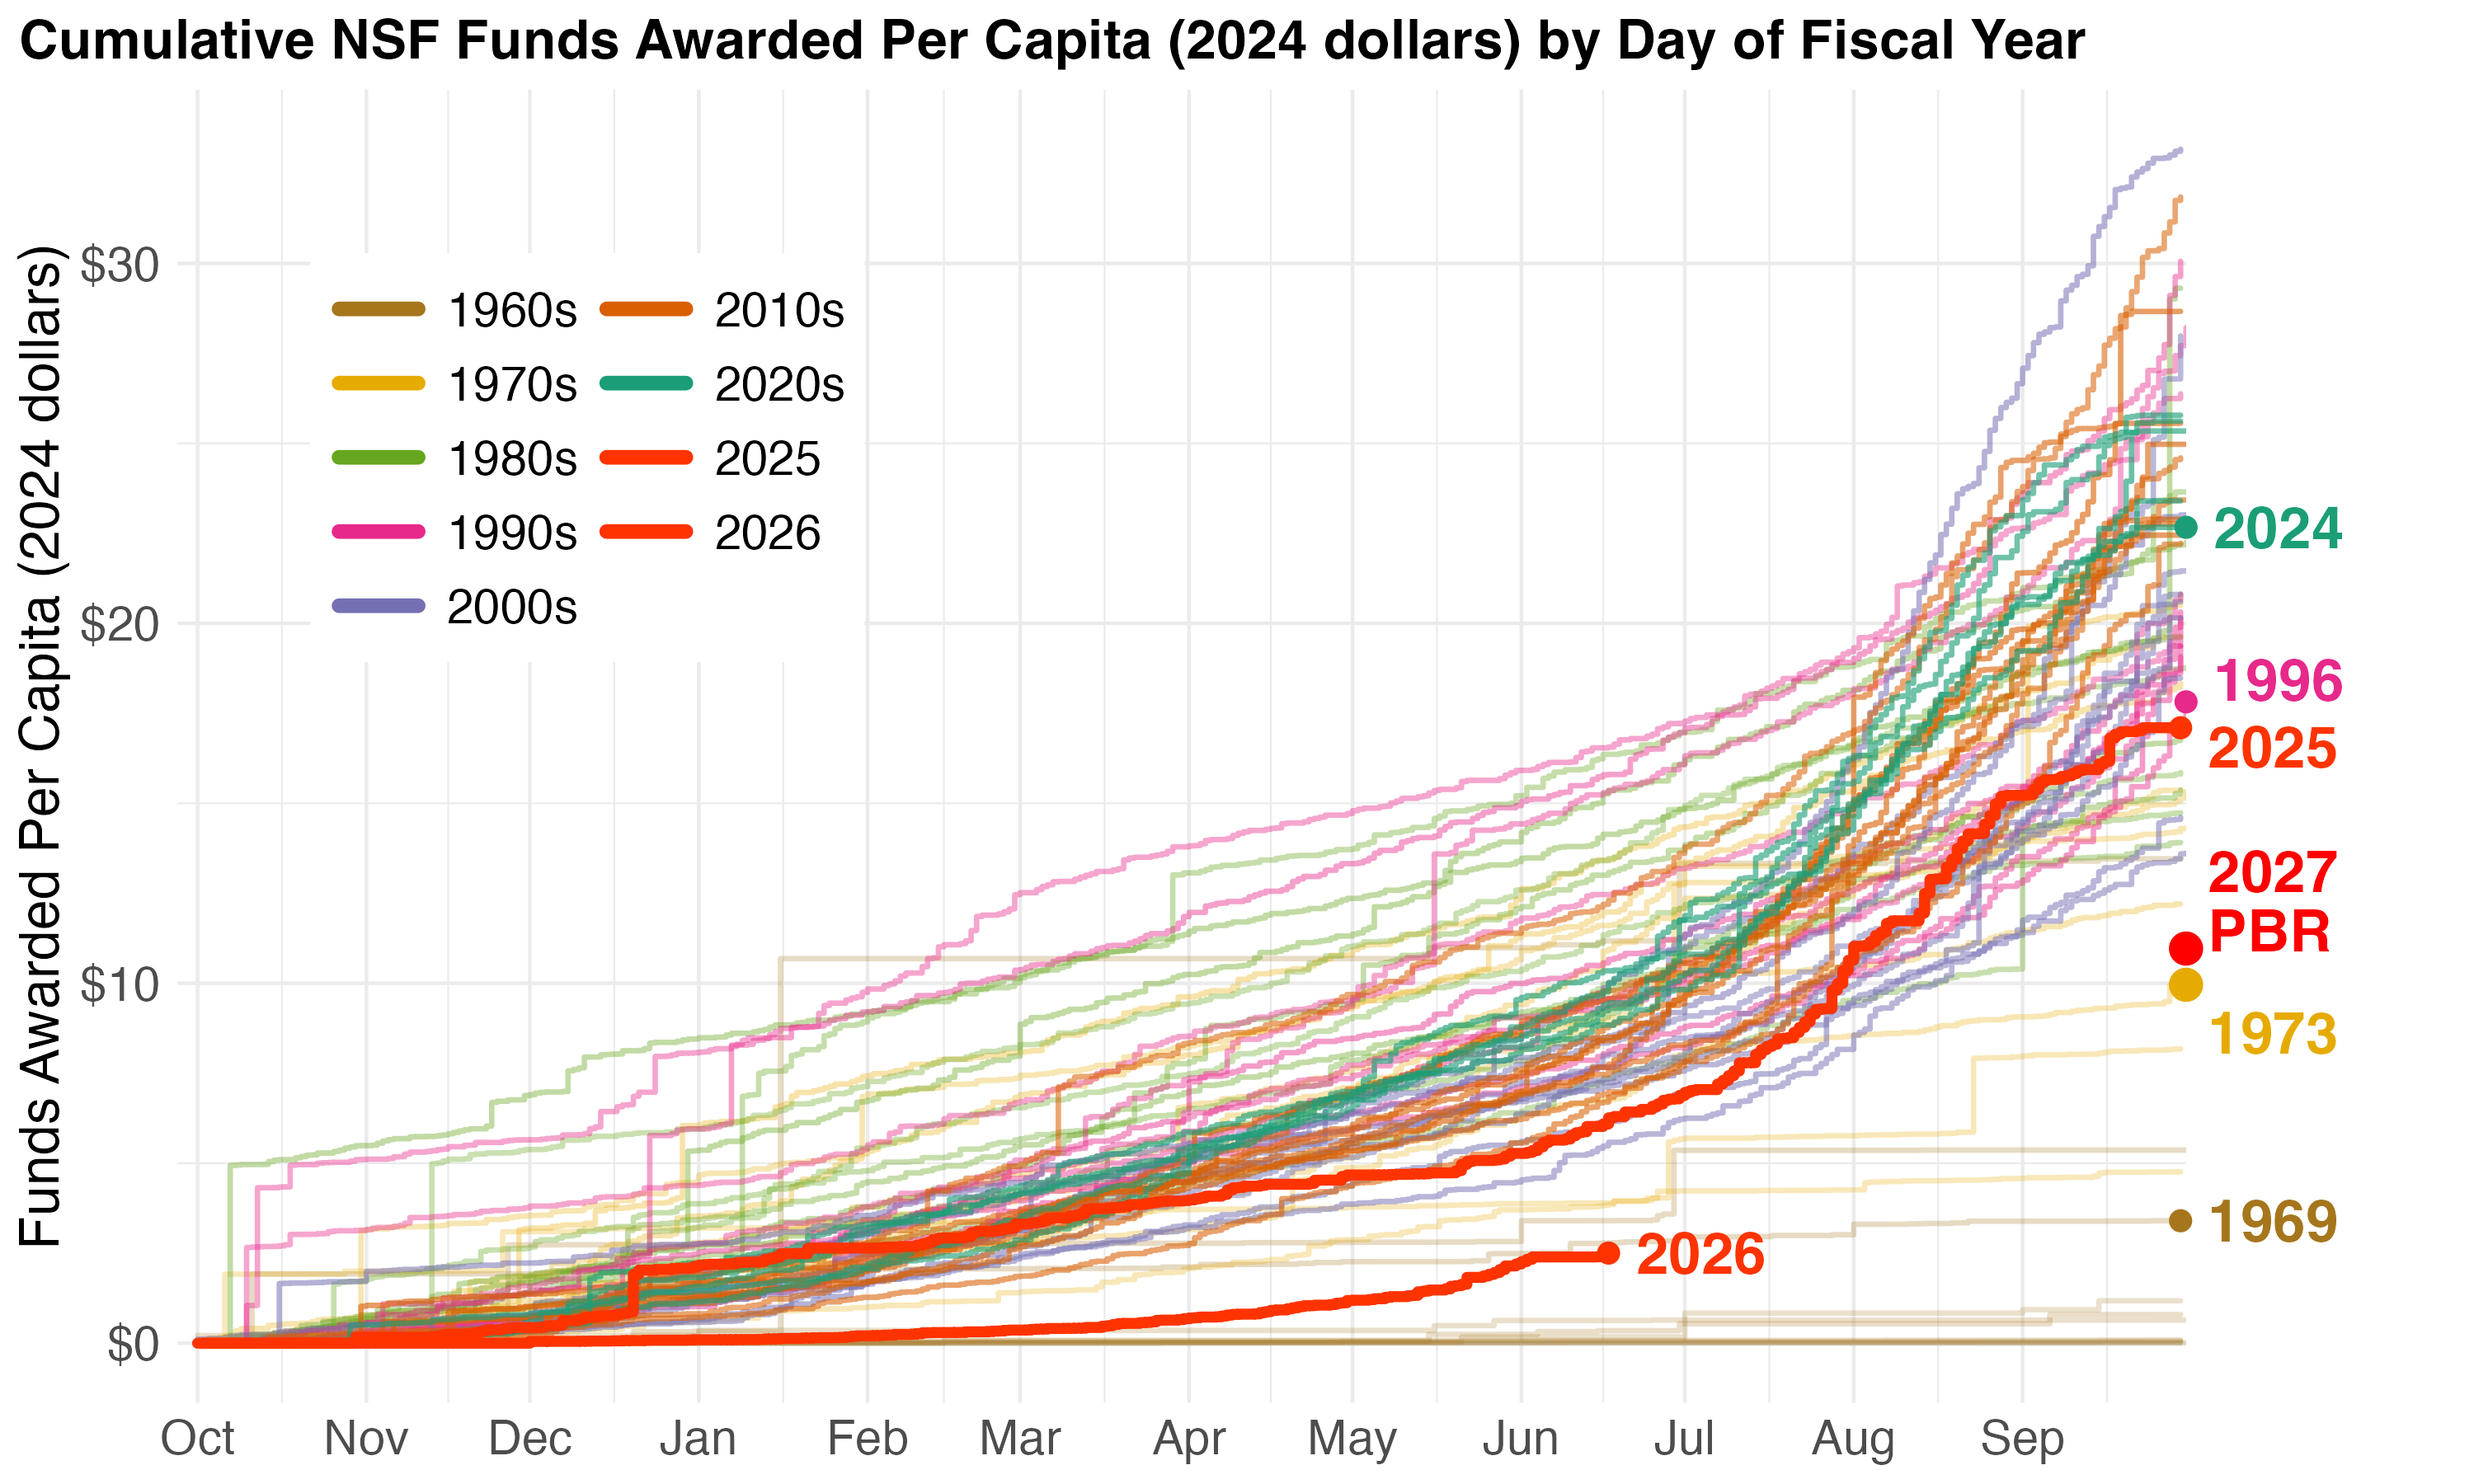
Even these stark numbers don’t paint the full picture, because comparing today’s numbers to the budgets so far back can be misleading. Below I plot the progression of awarded funds again, this time on a per capita, inflation adjusted basis to get a more apples-to-apples comparison across decades. Before the current administration, the NSF was spending $20-30 per American to fund scientific research each year. The 2020s, despite being high in absolute dollars, were far from outlier years. 2009, the year of the American Recovery and Reinvestment Act stimulus, was the peak of scientific investment in recent times. Last year’s throttling pulled us back to about $17, numbers last seen in the 1990s. While an acceleration of funding in the last months of the fiscal year could bring us back up, the current trajectory most resembles the level of investment in science last seen in 1969 during the height of the Vietnam War, and next year’s budget request is $11 per person, a level of investment last seen in 1973.
It is clear from the administration’s actions that they are attempting to end the public role of scientific funding as it has been for over fifty years, despite Congress, the courts, and the public’s support for scientific research. Far from reversal of some recent overreach, or a correction from a drift off course, this is a radical contraction of the American scientific enterprise to a level from before most of today’s Americans were even born.
If we allow this strangulation to continue for long, American science will not easily be recusitated.
Footnotes
These numbers are slightly different than those on our live funding curves page and NSF’s “By the Numbers” page. 8,650 reflects new award records, which can also include institutional transfers and some award renewals, though we attempt to filter these out. In our live curves, we use USAspending accounting data to help deduplicate and disambiguate these cases. The long-term historical data on awards is does not have similar detailed accounting data available.↩︎
These numbers are different than those on our live funding curves page. Long-term historical data on obligations - the formal commitment of funds to projects - is not available at the daily level as it is for more recent years. Instead here we assign the full expected budget value of each award to the date the grant was awarded. This means that the within-award timing of funding is not as accurate. Yet this is in some ways a more honest assessment. It reflects actual overall investment planned to be made for each new award, and is not distorted by the timing of when funds are obligated, which the administration has manipulated through forward-funding grants already in the pipeline rather than awarding new ones.↩︎