We made some adjustments to the NSF funding curves over the past week to address inconsistencies in how we combine research.gov and USAspending data. The methodology continues to be described in the Methods section.
With a series of new obligations to continuing awards in April, we had to adjust the way we handle the integration of the more up-to-date research.gov data with more comprehensive USAspending data. Research.gov does not break up within-fiscal year obligations more granularly than the fiscal year, so we made an assumption that those obligations occurred at the most recent update of the grants. While this held true for the first half of the fiscal year and most grants that receive one obligation per year, some continuing awards, especially large infrastructure projects, received additional new obligations in April after previous ones in late 2025. Due to our assumptions the combined obligations showed up as a single recent spike in April, while in reality they occurred in multiple installments. Now the month-to-month fluctuations have been re-arranged and now accurately show the timing of obligations early in the fiscal year, and avoid any double-counting with USAspending data.
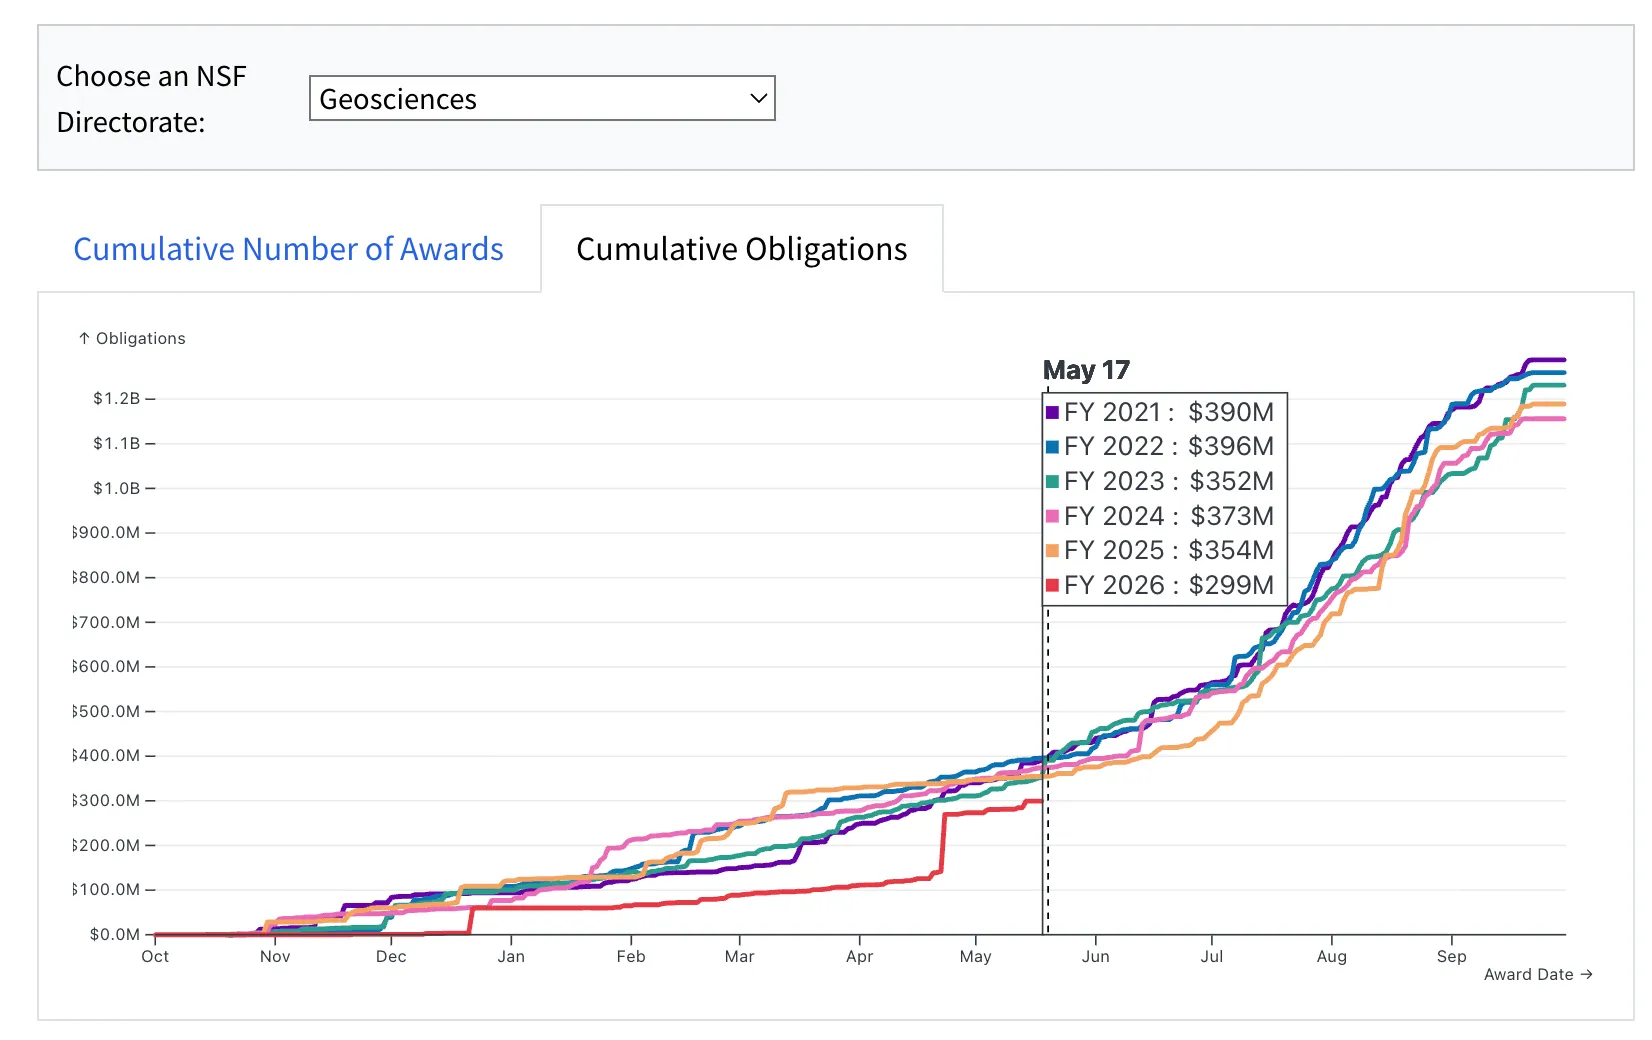
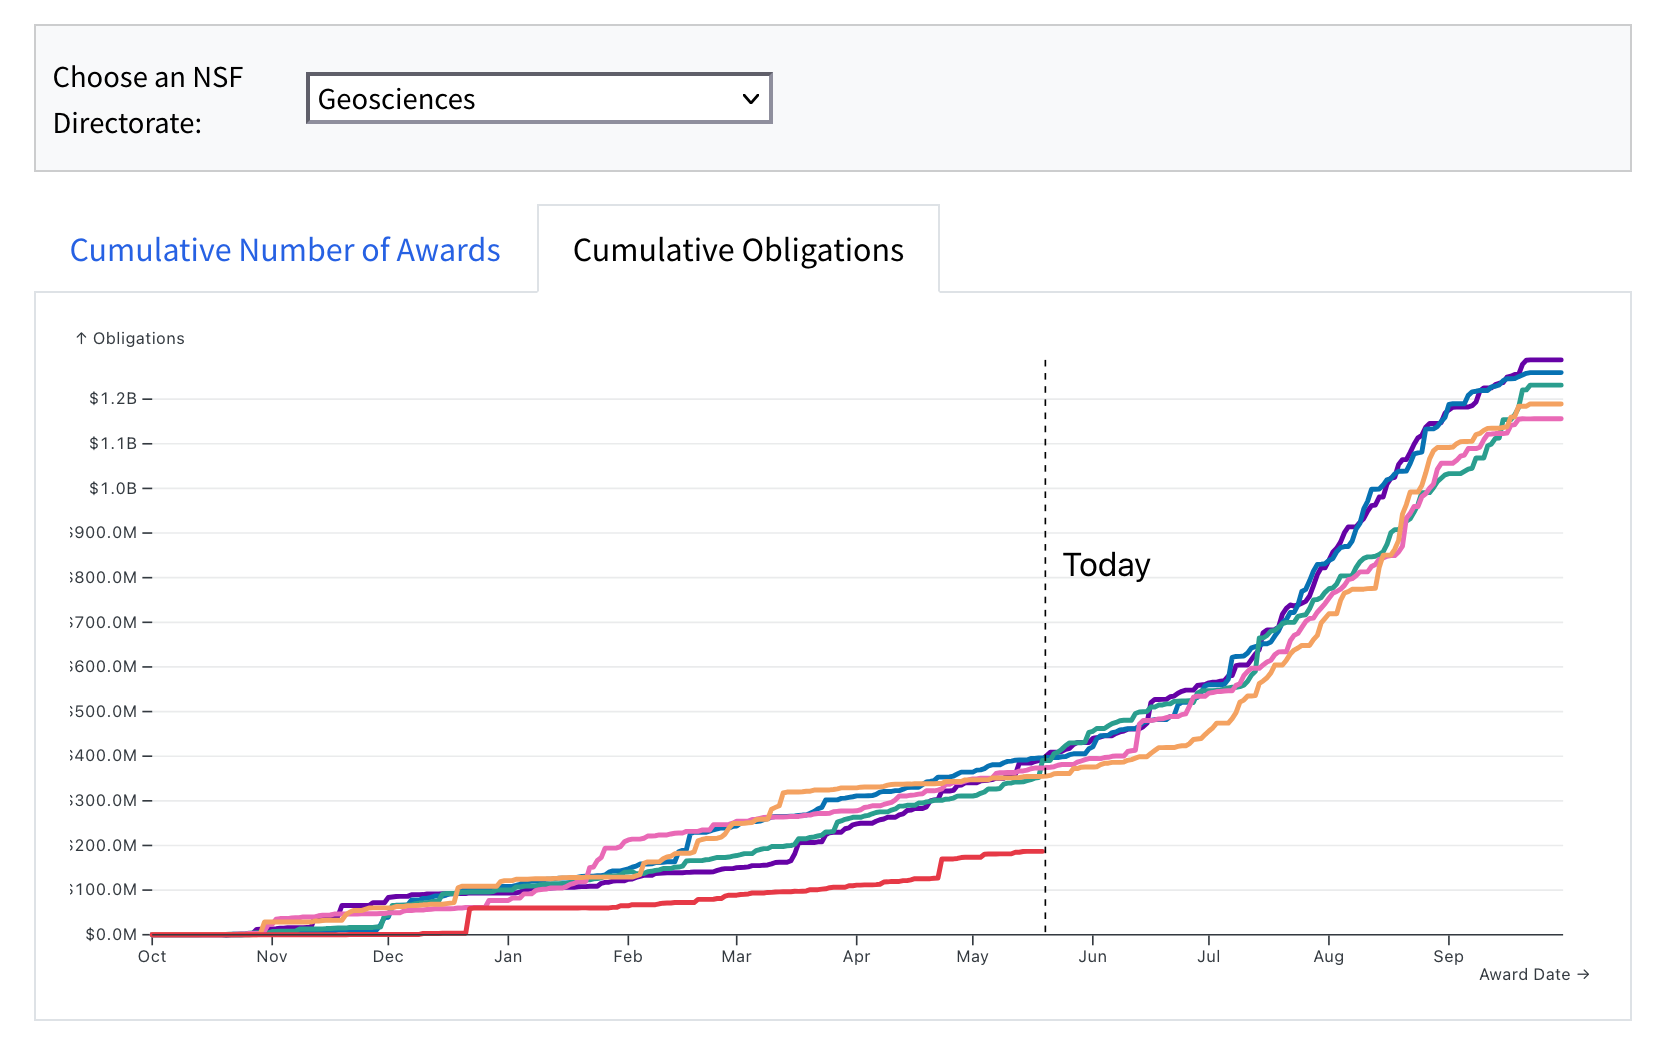
An example is can be seen in before-and-after plots of new obligations in the Geosciences Directorate. The first plot shows the old version of the curve, where the spike in April is visible. The second plot shows the updated curve. The difference is almost entirely due to the fact that the National Center for Atmospheric Research didn’t receive all its FY 2026 obligations in so far April, but split between December and April.
Thanks to Dan Garisto at Nature for flagging this issue.
As always, if you have any questions about our methodology or notice any issues in our data, please reach out at info@grant-witness.us.